shape: (4, 6)
┌─────────┬────────┬──────────┬───────┬──────────┬──────────┐
│ dataset ┆ mean_x ┆ mean_y   ┆ var_x ┆ var_y    ┆ corr_xy  │
│ ---     ┆ ---    ┆ ---      ┆ ---   ┆ ---      ┆ ---      │
│ str     ┆ f64    ┆ f64      ┆ f64   ┆ f64      ┆ f64      │
╞═════════╪════════╪══════════╪═══════╪══════════╪══════════╡
│ y1      ┆ 9.0    ┆ 7.500909 ┆ 11.0  ┆ 4.127269 ┆ 0.816421 │
│ y2      ┆ 9.0    ┆ 7.500909 ┆ 11.0  ┆ 4.127629 ┆ 0.816237 │
│ y3      ┆ 9.0    ┆ 7.5      ┆ 11.0  ┆ 4.12262  ┆ 0.816287 │
│ y4      ┆ 9.0    ┆ 7.500909 ┆ 11.0  ┆ 4.123249 ┆ 0.816521 │
└─────────┴────────┴──────────┴───────┴──────────┴──────────┘The Invisible Work of Data Science Projects
The Invisible Work
of
Data Science Projects
Those who receive the results of modern data analysis have limited opportunity to verify the results by direct observation. Users of the analysis have no option but to trust the analysis, and by extension the software that produced it. Both the data analyst and the software provider therefore have a strong responsibility to produce a result that is trustworthy, and, if possible, one that can be shown to be trustworthy.
— John M. Chambers

Data practitioners need to be trustworthy, and trusting.*
Procedural trust
Data provenance
Data lineage
Data contracts
Observability
Data dictionaries
Monitoring
Versioning
Unit tests
Code review
Disaggregation
Metadata
Confidence intervals
Data Provenance
Source
Transformations
Timeframe
Schema
Software version
Funding
Intent
Erasure
Handoffs
Datasheets for Datasets: https://arxiv.org/pdf/1803.09010
Exploratory Data Analysis
Exploratory Data Analysis
Anscombe’s Quartet
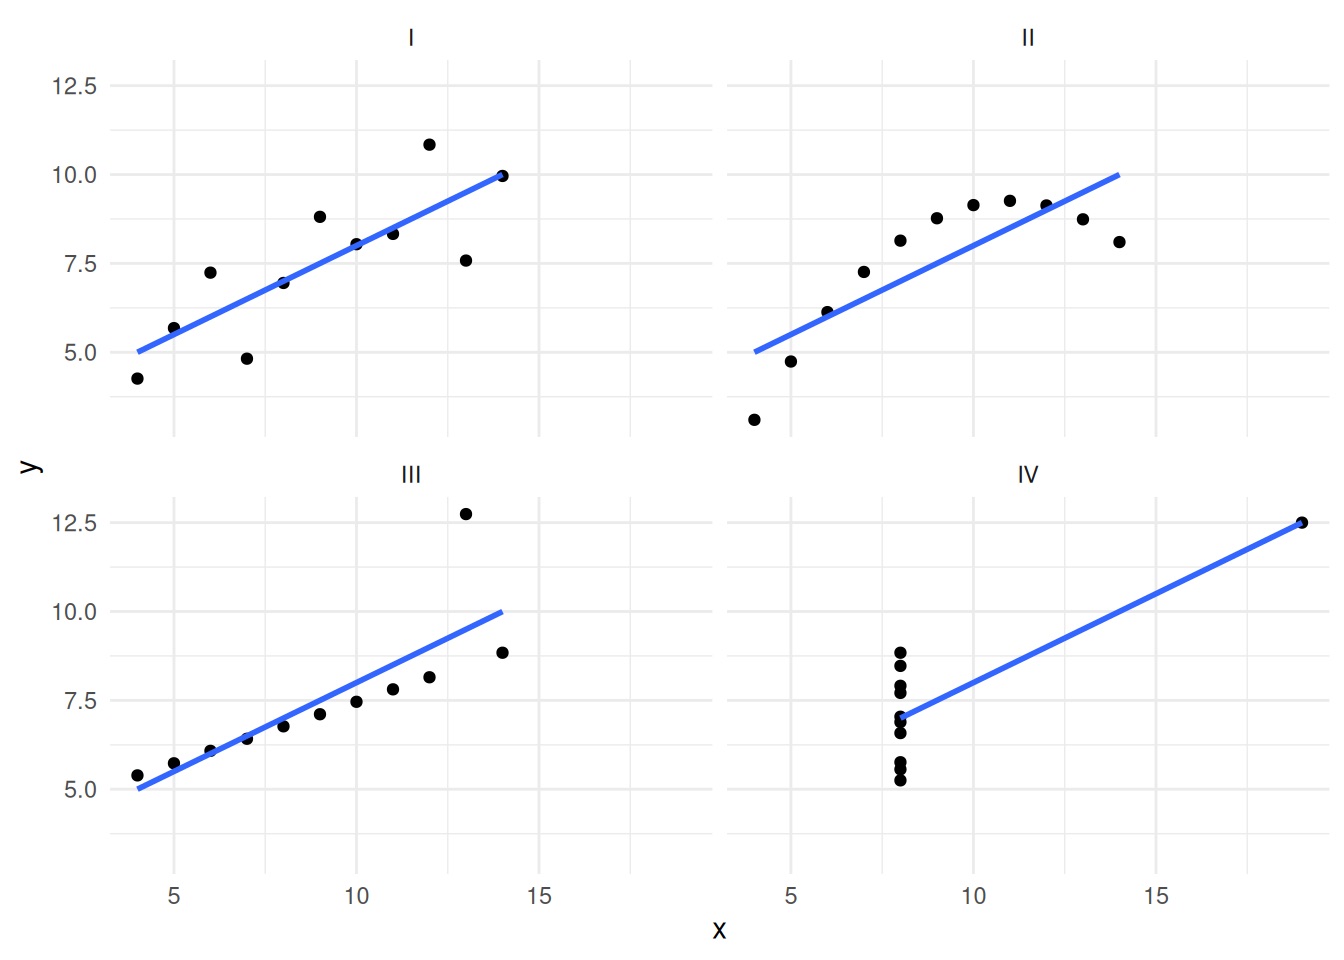
Photo by Jakub Żerdzicki on Unsplash
District Test Score Report
import polars as pl

district_data = pl.DataFrame({
    "district_id": ["D001", "D002", "D003", "D004", "D005"],
    "district_name": ["Lincoln", "Washington", "Jefferson", "Roosevelt", "Madison"],
    "year": [2025, 2025, 2025, 2025, 2025],
    "pct_proficient_math": [72.5, 45.2, 88.3, 91.5, 35.0],
    "pct_proficient_reading": [78.2, 52.1, 92.0, 89.0, 42.5],
    "change_math": [5.2, 12.5, 2.1, -1.2, 25.0],  # Year-over-year change
    "change_reading": [3.5, 8.5, 1.5, 0.5, 18.0],
})
View Data
Preview using pointblank:
PolarsRows5Columns7 |
|||||||
district_id String |
district_name String |
year Int64 |
pct_proficient_math Float64 |
pct_proficient_reading Float64 |
change_math Float64 |
change_reading Float64 |
|
|---|---|---|---|---|---|---|---|
| 1 | D001 | Lincoln | 2025 | 72.5 | 78.2 | 5.2 | 3.5 |
| 2 | D002 | Washington | 2025 | 45.2 | 52.1 | 12.5 | 8.5 |
| 3 | D003 | Jefferson | 2025 | 88.3 | 92.0 | 2.1 | 1.5 |
| 4 | D004 | Roosevelt | 2025 | 91.5 | 89.0 | -1.2 | 0.5 |
| 5 | D005 | Madison | 2025 | 35.0 | 42.5 | 25.0 | 18.0 |
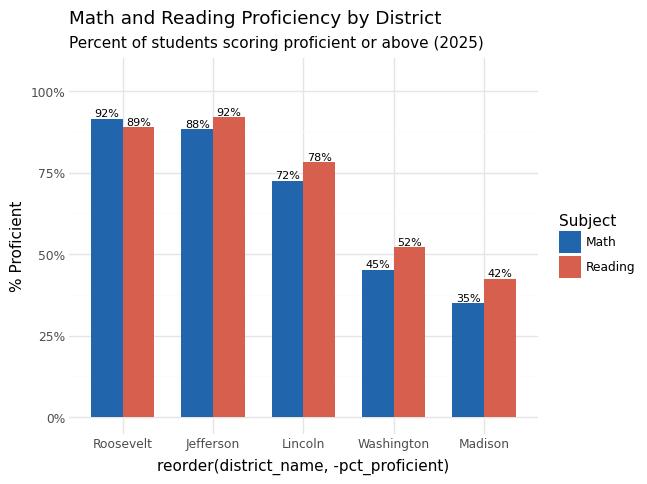
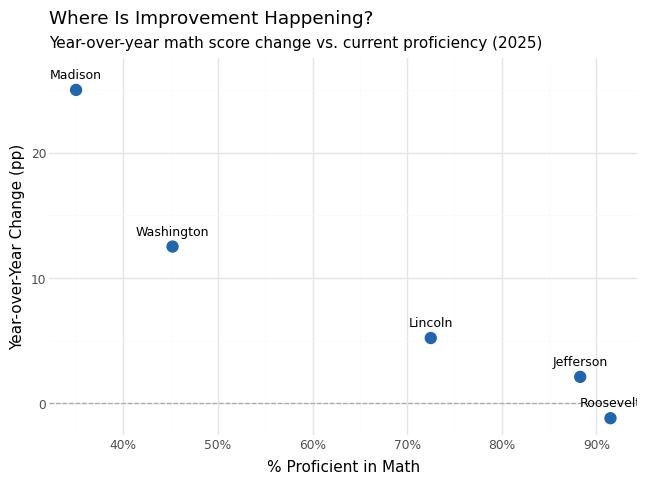
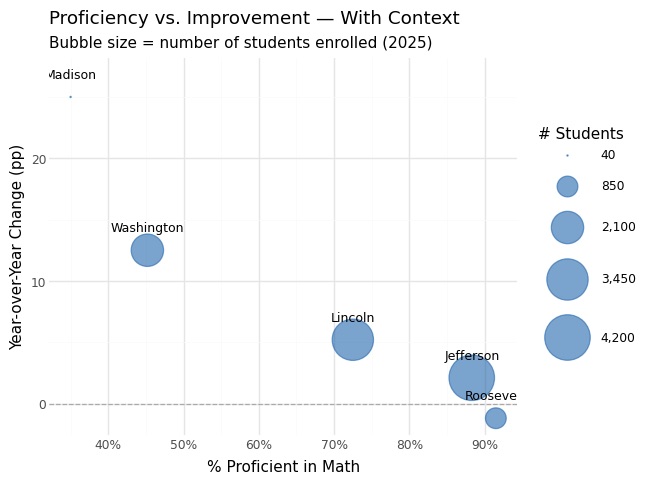
- Math ranges from 35.0% (Madison) to 91.5% (Roosevelt); reading from 42.5% to 92.0%.
Deeper Dive
Polarsdistrict_test_scores_receivedRows5Columns7 |
|||||||||||||
| Column | NA | UQ | Mean | SD | Min | P5 | Q1 | Med | Q3 | P95 | Max | IQR | |
|---|---|---|---|---|---|---|---|---|---|---|---|---|---|
district_id String |
0 0 |
5 1 |
4 | 0 | 4 | 4 | 4 | 4 | 4 | 4 | 4 | 0 | |
district_name String |
0 0 |
5 1 |
8.4 | 1.34 | 7 | 7 | 7 | 9 | 9 | 9.8 | 10 | 2 | |
year Int64 |
0 0 |
1 0.2 |
2,025 | 0 | 2025 | 2,025 | 2,025 | 2,025 | 2,025 | 2,025 | 2025 | 0 | |
pct_proficient_math Float64 |
0 0 |
5 1 |
66.5 | 25.41 | 35.0 | 35.2 | 45.2 | 72.5 | 88.3 | 90.86 | 91.5 | 43.1 | |
pct_proficient_reading Float64 |
0 0 |
5 1 |
70.76 | 22.28 | 42.5 | 42.69 | 52.1 | 78.2 | 89 | 91.4 | 92.0 | 36.9 | |
change_math Float64 |
0 0 |
5 1 |
8.72 | 10.42 | -1.2 | −1.13 | 2.1 | 5.2 | 12.5 | 22.5 | 25.0 | 10.4 | |
change_reading Float64 |
0 0 |
5 1 |
6.4 | 7.18 | 0.5 | 0.52 | 1.5 | 3.5 | 8.5 | 16.1 | 18.0 | 7 | |
| String columns statistics regard the string's length. | |||||||||||||
- High standard deviations (~25pp math, ~22pp reading) reflect large inequality between districts.
Make Plots
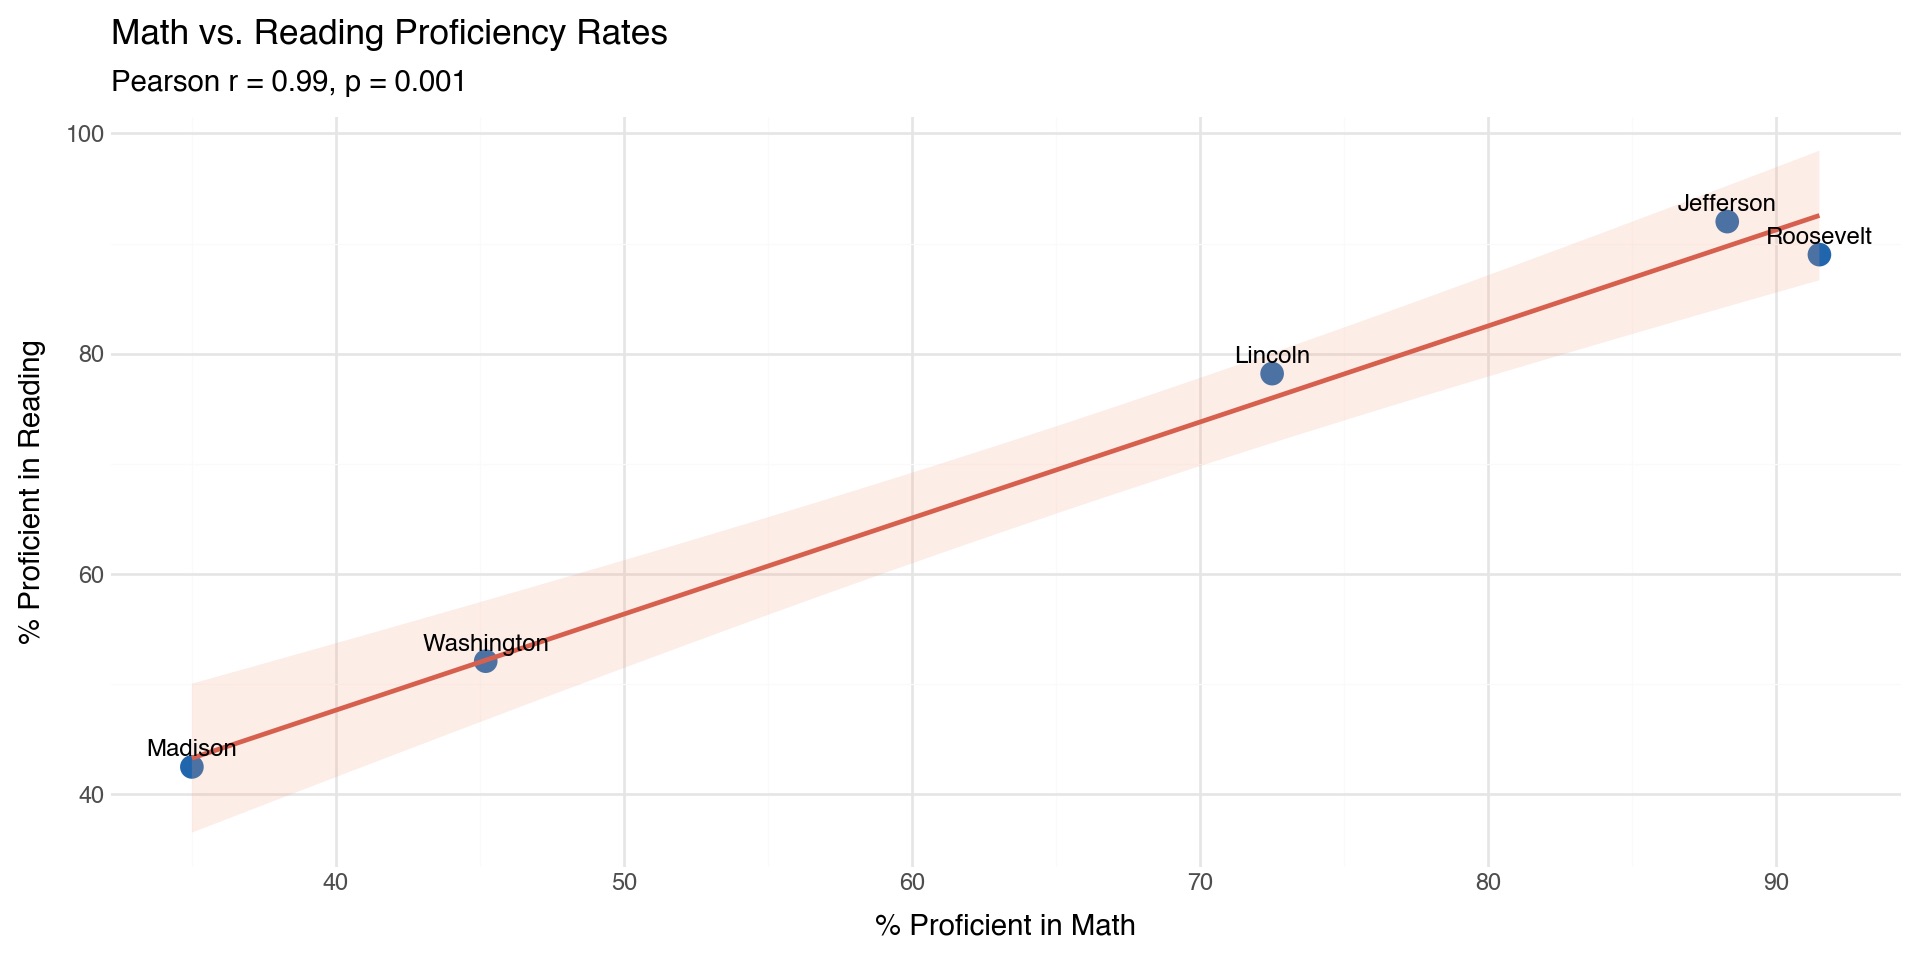
- Strong positive correlation between math and reading proficiency.
Data Validation
Data Validation
- Thresholds
- Ranges
- Type Check
- Formats and Patterns
- Consistency
- Presence
Student Counts
counts_data = pl.DataFrame(
    {
        "district_id": ["D001", "D002", "D003", "D004", "D005"],
        "year": [2025, 2025, 2025, 2025, 2025],
        "num_students": [3450, 2100, 4200, 850, 40],
        "students_proficient_math": [2501, 949, 3709, 778, 14],
        "students_proficient_reading": [2697, 1094, 3864, 757, 17],
    }
)

pb.preview(counts_data)PolarsRows5Columns5 |
|||||
district_id String |
year Int64 |
num_students Int64 |
students_proficient_math Int64 |
students_proficient_reading Int64 |
|
|---|---|---|---|---|---|
| 1 | D001 | 2025 | 3450 | 2501 | 2697 |
| 2 | D002 | 2025 | 2100 | 949 | 1094 |
| 3 | D003 | 2025 | 4200 | 3709 | 3864 |
| 4 | D004 | 2025 | 850 | 778 | 757 |
| 5 | D005 | 2025 | 40 | 14 | 17 |
Complete Dataset After Joining
complete_data = district_data.join(counts_data, on=["district_id", "year"], how="left")

pb.preview(complete_data)PolarsRows5Columns10 |
||||||||||
district_id String |
district_name String |
year Int64 |
pct_proficient_math Float64 |
pct_proficient_reading Float64 |
change_math Float64 |
change_reading Float64 |
num_students Int64 |
students_proficient_math Int64 |
students_proficient_reading Int64 |
|
|---|---|---|---|---|---|---|---|---|---|---|
| 1 | D001 | Lincoln | 2025 | 72.5 | 78.2 | 5.2 | 3.5 | 3450 | 2501 | 2697 |
| 2 | D002 | Washington | 2025 | 45.2 | 52.1 | 12.5 | 8.5 | 2100 | 949 | 1094 |
| 3 | D003 | Jefferson | 2025 | 88.3 | 92.0 | 2.1 | 1.5 | 4200 | 3709 | 3864 |
| 4 | D004 | Roosevelt | 2025 | 91.5 | 89.0 | -1.2 | 0.5 | 850 | 778 | 757 |
| 5 | D005 | Madison | 2025 | 35.0 | 42.5 | 25.0 | 18.0 | 40 | 14 | 17 |
Return to EDA
Polarsdistrict_test_scores_completeRows5Columns10 |
|||||||||||||
| Column | NA | UQ | Mean | SD | Min | P5 | Q1 | Med | Q3 | P95 | Max | IQR | |
|---|---|---|---|---|---|---|---|---|---|---|---|---|---|
district_id String |
0 0 |
5 1 |
4 | 0 | 4 | 4 | 4 | 4 | 4 | 4 | 4 | 0 | |
district_name String |
0 0 |
5 1 |
8.4 | 1.34 | 7 | 7 | 7 | 9 | 9 | 9.8 | 10 | 2 | |
year Int64 |
0 0 |
1 0.2 |
2,025 | 0 | 2025 | 2,025 | 2,025 | 2,025 | 2,025 | 2,025 | 2025 | 0 | |
pct_proficient_math Float64 |
0 0 |
5 1 |
66.5 | 25.41 | 35.0 | 35.2 | 45.2 | 72.5 | 88.3 | 90.86 | 91.5 | 43.1 | |
pct_proficient_reading Float64 |
0 0 |
5 1 |
70.76 | 22.28 | 42.5 | 42.69 | 52.1 | 78.2 | 89 | 91.4 | 92.0 | 36.9 | |
change_math Float64 |
0 0 |
5 1 |
8.72 | 10.42 | -1.2 | −1.13 | 2.1 | 5.2 | 12.5 | 22.5 | 25.0 | 10.4 | |
change_reading Float64 |
0 0 |
5 1 |
6.4 | 7.18 | 0.5 | 0.52 | 1.5 | 3.5 | 8.5 | 16.1 | 18.0 | 7 | |
num_students Int64 |
0 0 |
5 1 |
2,128 | 1,734.55 | 40 | 56.2 | 850 | 2,100 | 3,450 | 4,050 | 4200 | 2,600 | |
students_proficient_math Int64 |
0 0 |
5 1 |
1,590.2 | 1,489.47 | 14 | 29.28 | 778 | 949 | 2,501 | 3,467.4 | 3709 | 1,723 | |
students_proficient_reading Int64 |
0 0 |
5 1 |
1,685.8 | 1,562.44 | 17 | 31.8 | 757 | 1,094 | 2,697 | 3,630.6 | 3864 | 1,940 | |
| String columns statistics regard the string's length. | |||||||||||||
Validate the Join Succeeded
validation = (
    pb.Validate(
        data=complete_data,
        tbl_name="school_district_scores",
        label="School District Test Score Analysis - Post-Join Validation",
    )
    .col_exists(columns=["district_id", "pct_proficient_math", "change_math"])
    .col_exists(
        columns=[
            "num_students",
            "students_proficient_math",
            "students_proficient_reading",
        ]
    )
    .col_vals_not_null(columns=["num_students", "students_proficient_math"])
    .col_vals_gt(columns=["num_students"], value=0)
    .col_vals_ge(columns=["students_proficient_math"], value=0)
)

validation.interrogate().get_tabular_report()Validate the Join Succeeded
| Pointblank Validation | |||||||||||||
School District Test Score Analysis - Post-Join Validation Polarsschool_district_scores |
|||||||||||||
| STEP | COLUMNS | VALUES | TBL | EVAL | UNITS | PASS | FAIL | W | E | C | EXT | ||
|---|---|---|---|---|---|---|---|---|---|---|---|---|---|
| #4CA64C | 1 |
col_exists()
|
district_id | — | ✓ | 1 | 1 1.00 |
0 0.00 |
— | — | — | — | |
| #4CA64C | 2 |
col_exists()
|
pct_proficient_math | — | ✓ | 1 | 1 1.00 |
0 0.00 |
— | — | — | — | |
| #4CA64C | 3 |
col_exists()
|
change_math | — | ✓ | 1 | 1 1.00 |
0 0.00 |
— | — | — | — | |
| #4CA64C | 4 |
col_exists()
|
num_students | — | ✓ | 1 | 1 1.00 |
0 0.00 |
— | — | — | — | |
| #4CA64C | 5 |
col_exists()
|
students_proficient_math | — | ✓ | 1 | 1 1.00 |
0 0.00 |
— | — | — | — | |
| #4CA64C | 6 |
col_exists()
|
students_proficient_reading | — | ✓ | 1 | 1 1.00 |
0 0.00 |
— | — | — | — | |
| #4CA64C | 7 |
col_vals_not_null()
|
num_students | — | ✓ | 5 | 5 1.00 |
0 0.00 |
— | — | — | — | |
| #4CA64C | 8 |
col_vals_not_null()
|
students_proficient_math | — | ✓ | 5 | 5 1.00 |
0 0.00 |
— | — | — | — | |
| #4CA64C | 9 |
col_vals_gt()
|
num_students | 0 | ✓ | 5 | 5 1.00 |
0 0.00 |
— | — | — | — | |
| #4CA64C | 10 |
col_vals_ge()
|
students_proficient_math | 0 | ✓ | 5 | 5 1.00 |
0 0.00 |
— | — | — | — | |
2026-04-16 15:11:56 UTC< 1 s2026-04-16 15:11:56 UTC |
|||||||||||||
Validate That Percentages Match the Counts
verification = complete_data.with_columns(
    [
        (pl.col("students_proficient_math") / pl.col("num_students") * 100)
        .round(1)
        .alias("calculated_pct_math"),
        (pl.col("students_proficient_reading") / pl.col("num_students") * 100)
        .round(1)
        .alias("calculated_pct_reading"),
    ]
).with_columns(
    [
        (pl.col("pct_proficient_math") == pl.col("calculated_pct_math"))
        .cast(pl.Int64)
        .alias("math_pct_matches"),
        (pl.col("pct_proficient_reading") == pl.col("calculated_pct_reading"))
        .cast(pl.Int64)
        .alias("reading_pct_matches"),
    ]
)

verification_summary = verification.select(
    [
        "district_name",
        "num_students",
        "students_proficient_math",
        "pct_proficient_math",
        "calculated_pct_math",
        "math_pct_matches",
    ]
)

pb.preview(verification_summary)
Validate That Percentages Match the Counts
PolarsRows5Columns6 |
||||||
district_name String |
num_students Int64 |
students_proficient_math Int64 |
pct_proficient_math Float64 |
calculated_pct_math Float64 |
math_pct_matches Int64 |
|
|---|---|---|---|---|---|---|
| 1 | Lincoln | 3450 | 2501 | 72.5 | 72.5 | 1 |
| 2 | Washington | 2100 | 949 | 45.2 | 45.2 | 1 |
| 3 | Jefferson | 4200 | 3709 | 88.3 | 88.3 | 1 |
| 4 | Roosevelt | 850 | 778 | 91.5 | 91.5 | 1 |
| 5 | Madison | 40 | 14 | 35.0 | 35.0 | 1 |
Validate That ALL Percentages Match
validation_percentage_consistency = (
    pb.Validate(
        data=verification,
        tbl_name="school_district_scores",
        label="Percentage-Count Consistency Check",
    )
    .rows_distinct(columns_subset=["district_id", "year"])
    .col_vals_eq(columns=["math_pct_matches"], value=1)
    .col_vals_eq(columns=["reading_pct_matches"], value=1)
)

validation_percentage_consistency.interrogate().get_tabular_report()Validate That ALL Percentages Match
Validate Percentage-Count Consistency
validation_with_consistency = (
    pb.Validate(
        data=complete_data,
        tbl_name="school_district_scores",
        label="Percentage-Count Consistency Validation",
    )
    .col_vals_between(columns=["pct_proficient_math"], left=0, right=100)
    .col_vals_between(columns=["pct_proficient_reading"], left=0, right=100)
    .col_vals_le(columns=["students_proficient_math"], value=pb.col("num_students"))
    .col_vals_le(columns=["students_proficient_reading"], value=pb.col("num_students"))
)

validation_with_consistency.interrogate().get_tabular_report()Validate Percentage-Count Consistency
| Pointblank Validation | |||||||||||||
Percentage-Count Consistency Validation Polarsschool_district_scores |
|||||||||||||
| STEP | COLUMNS | VALUES | TBL | EVAL | UNITS | PASS | FAIL | W | E | C | EXT | ||
|---|---|---|---|---|---|---|---|---|---|---|---|---|---|
| #4CA64C | 1 |
col_vals_between()
|
pct_proficient_math | [0, 100] | ✓ | 5 | 5 1.00 |
0 0.00 |
— | — | — | — | |
| #4CA64C | 2 |
col_vals_between()
|
pct_proficient_reading | [0, 100] | ✓ | 5 | 5 1.00 |
0 0.00 |
— | — | — | — | |
| #4CA64C | 3 |
col_vals_le()
|
students_proficient_math | num_students | ✓ | 5 | 5 1.00 |
0 0.00 |
— | — | — | — | |
| #4CA64C | 4 |
col_vals_le()
|
students_proficient_reading | num_students | ✓ | 5 | 5 1.00 |
0 0.00 |
— | — | — | — | |
2026-04-16 15:11:57 UTC< 1 s2026-04-16 15:11:57 UTC |
|||||||||||||
Create a “Safe to Report” Flag
reporting_data = complete_data.with_columns(
    [
        pl.when(pl.col("num_students") >= 100)
        .then(pl.lit("✅ Reliable"))
        .when(pl.col("num_students") >= 50)
        .then(pl.lit("⚠️  Use with caution"))
        .otherwise(pl.lit("❌ Too small"))
        .alias("reliability_flag"),
        (pl.col("num_students") * pl.col("change_math") / 100)
        .round(0)
        .cast(pl.Int64)
        .alias("students_improved_math"),
    ]
)

reporting_summary = reporting_data.select(
    [
        "district_name",
        "num_students",
        "change_math",
        "students_improved_math",
        "reliability_flag",
    ]
).sort("change_math", descending=True)

pb.preview(reporting_summary)Create a “Safe to Report” Flag
PolarsRows5Columns5 |
|||||
district_name String |
num_students Int64 |
change_math Float64 |
students_improved_math Int64 |
reliability_flag String |
|
|---|---|---|---|---|---|
| 1 | Madison | 40 | 25.0 | 10 | ❌ Too small |
| 2 | Washington | 2100 | 12.5 | 262 | ✅ Reliable |
| 3 | Lincoln | 3450 | 5.2 | 179 | ✅ Reliable |
| 4 | Jefferson | 4200 | 2.1 | 88 | ✅ Reliable |
| 5 | Roosevelt | 850 | -1.2 | -10 | ✅ Reliable |
Code-First Data Science
Photo by Artturi Jalli on Unsplash
Your Code As Documentation
Data Integration Decision
- Two separate data sources
- This wasn’t the original structure
Join Strategy
- All districts from district_data are kept, even if they don’t have matching counts
- Prefer incomplete data over lost data
Your Code As Documentation
Matching Logic
- Two keys used: district_id AND year define uniqueness
- Assumption made explicit: A district in a specific year is the unit of analysis
- Time dimension matters: The same district across different years are separate records
Your Code + Narrative As Documentation
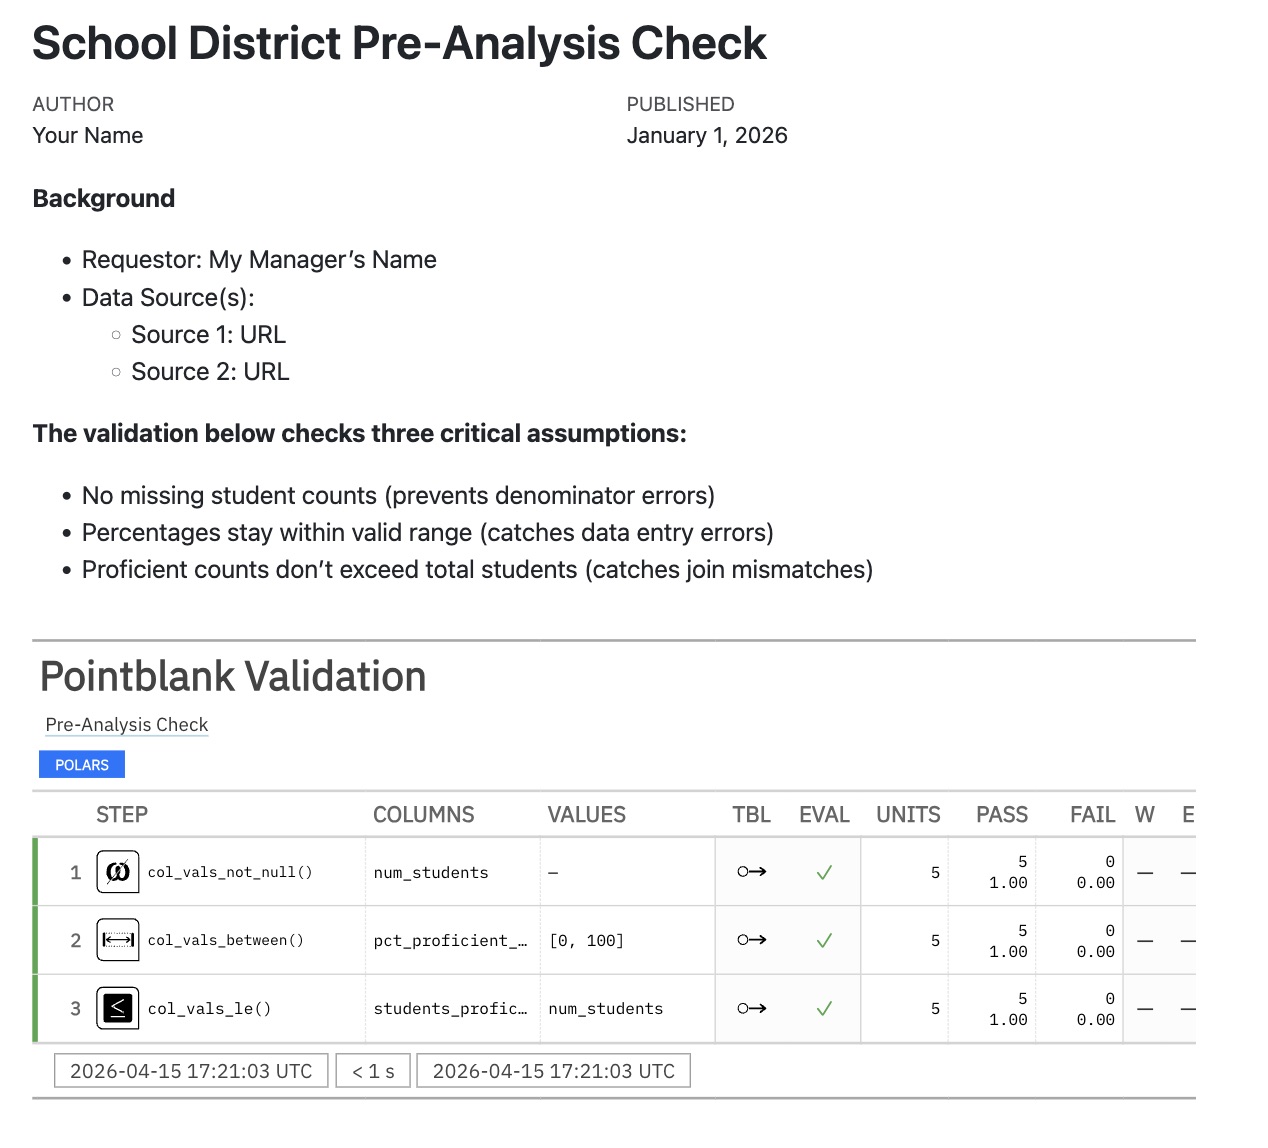
validation-report.qmd
---
title: "School District Pre-Analysis Check"
date: 2026-01-01
author: Your Name
---
**Background**
* Requestor: My Manager's Name
* Data Source(s):
* Source 1: URL
* Source 2: URL
**The validation below checks three critical assumptions:**
- No missing student counts (prevents denominator errors)
- Percentages stay within valid range (catches data entry errors)
- Proficient counts don't exceed total students (catches join mismatches)
```{python}
#| echo: false
import polars as pl
import pointblank as pb
# Create district_data
district_data = pl.DataFrame({
"district_id": ["D001", "D002", "D003", "D004", "D005"],
"district_name": ["Lincoln", "Washington", "Jefferson", "Roosevelt", "Madison"],
"year": [2025, 2025, 2025, 2025, 2025],
"pct_proficient_math": [73.0, 45.2, 88.3, 91.5, 35.0],
"pct_proficient_reading": [78.2, 52.1, 92.0, 89.0, 42.5],
"change_math": [5.2, 12.5, 2.1, -1.2, 25.0],
"change_reading": [3.5, 8.5, 1.5, 0.5, 18.0],
})
# Create counts_data
counts_data = pl.DataFrame({
"district_id": ["D001", "D002", "D003", "D004", "D005"],
"year": [2025, 2025, 2025, 2025, 2025],
"num_students": [3450, 2100, 4200, 850, 40],
"students_proficient_math": [2501, 949, 3709, 778, 14],
"students_proficient_reading": [2697, 1094, 3864, 757, 17],
})
# Join to create complete_data
complete_data = district_data.join(
    counts_data, on=["district_id", "year"], how="left"
)
validation = (
pb.Validate(data=complete_data, label="Pre-Analysis Check")
.col_vals_not_null(columns=["num_students"])
.col_vals_between(columns=["pct_proficient_math"], left=0, right=100)
.col_vals_le(columns=["students_proficient_math"], value=pb.col("num_students"))
)
validation.interrogate().get_tabular_report()
```Your Code + Narrative As Documentation
Reproducibility
Photo by Chinh Le Duc on Unsplash
Your Machine
My Machine
Open Source Tools
Photo by Markus Winkler on Unsplash
Version Control
Version Control
- Track every change made to your files
- Multiple people working on the same files
- Have a “master” source of truth
- Go back to a previous “working” version
- Serves as a history log
- Know exactly who changed what and when
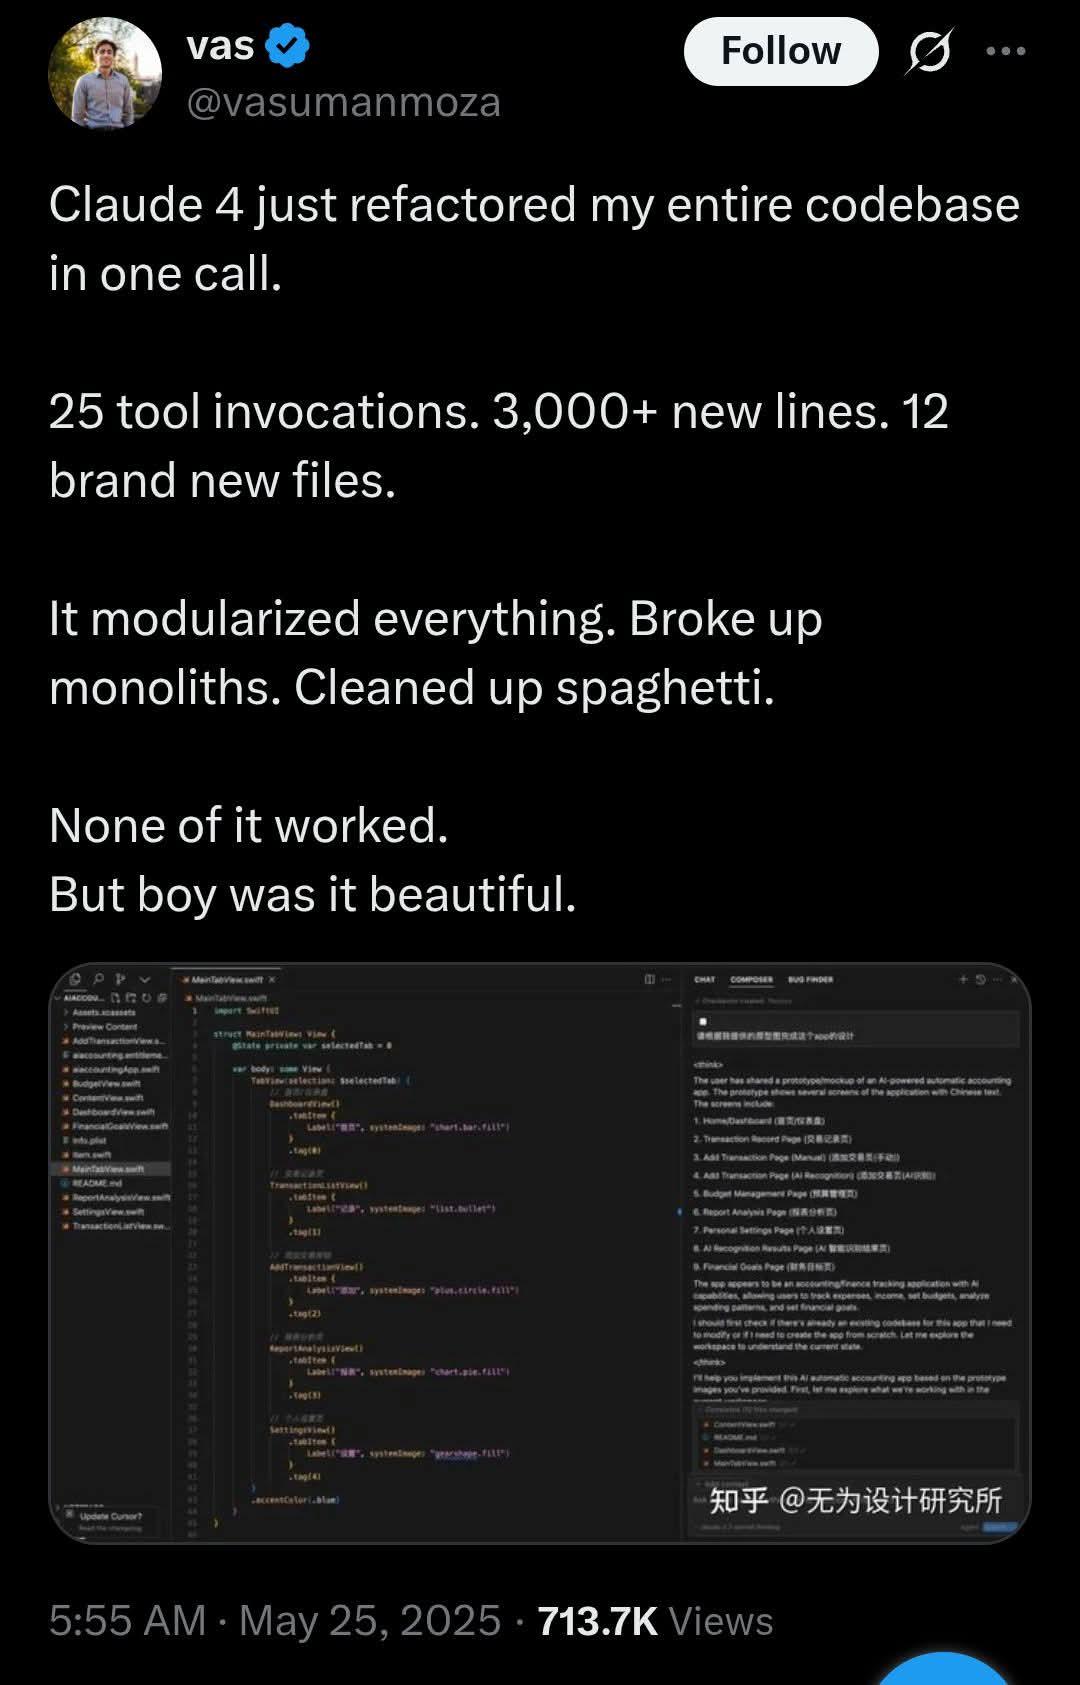
LLM Guardrails and Oversight
Claude Code
Databot
…Both the data analyst and the software provider therefore have a strong responsibility to produce a result that is trustworthy, and, if possible, one that can be shown to be trustworthy…
The Problems with LLMs
- Data provenance: Training data is proprietary and undisclosed
- Data lineage: Cannot trace how inputs become outputs
- Data contracts: No guarantees about output format or correctness
- Observability: Decision-making process is opaque
- Data dictionaries: No clear mapping of concepts or definitions used
- Monitoring: No way to detect when model behavior changes
- Versioning: Model updates are released without change logs
- Unit tests: Non-deterministic outputs cannot be reliably tested
- Code review: Cannot inspect the “reasoning” that led to an answer
- Disaggregation: Cannot break down how confidence is distributed
- Metadata: Limited information about training, capabilities, or limitations
- Confidence intervals: Provides fluent answers with no statistical uncertainty
- …


Know the Fundamentals
Photo by Unseen Studio on Unsplash

Data Validation Checks for AI Work

Use LLMs As Tutors and Reviewers
Photo by Unseen Studio on Unsplash


Break Up The Process


Use Planning Mode
Version Control

Wrap Up
trusting*
Thank You